What are measures of dispersion
Dispersion or Spread is the extent to which the observations vary about their mean in a dataset. The quantity that measures a dispersion in a data set is known as measure of dispersion. It is used to check variability/spread of data i.e. to know how much homogenous or heterogeneous the data is. The measure of dispersion are of two types that is absolute and relative dispersion.
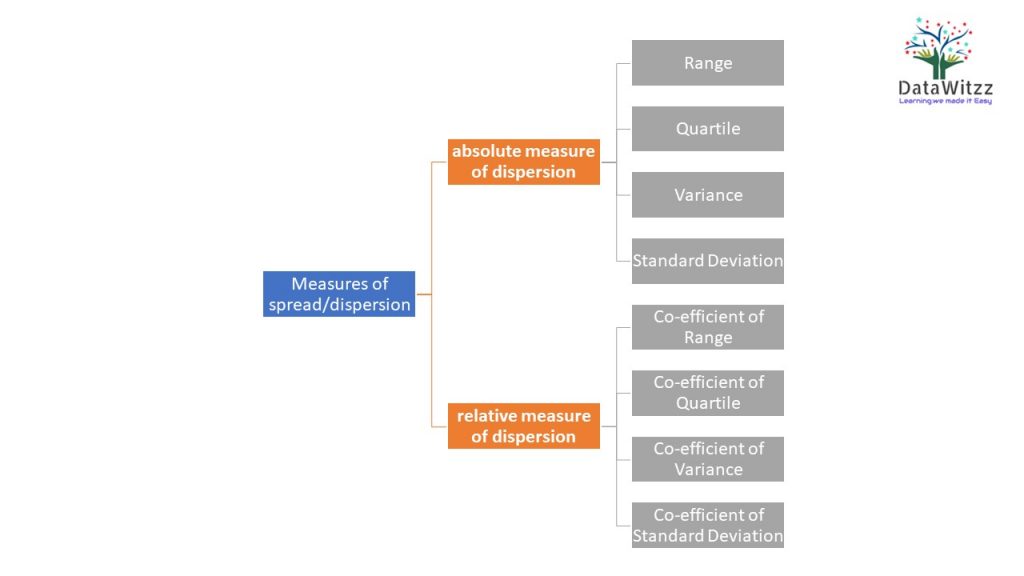
An absolute measure of dispersion is one that measures dispersion in terms of the same units as the unit of data. if the unit of data is meter, kilogram or mile then measure of dispersion will be in the same unit.
A relative measure of dispersion is being expressed in the form of ratio, percentage or co-efficient. Unit of data is not relevant in relative measure of dispersion. It is used to compare measure of dispersion of two or more data sets.
The main measure of dispersions are range, inter quartile range, variance, standard deviation, mean deviation and semi inter quartile range.
Range: Range is the difference between the maximum and the minimum data point of a data set.
Range=Xmax – Xmin
Range gives us an idea of the total spread of the observations of the dataset. It is not very prominent in statistics but a very useful in quality control where in measurement is to be kept in a certain range of value.
Quartile: Quartile break our data set into quarters according to where those numbers falls in the number line. Quartiles are three points on number line which breaks data into four equal group. Each quarter represents 25% of the data set. It explains behavior of data set in a very meaningful way.
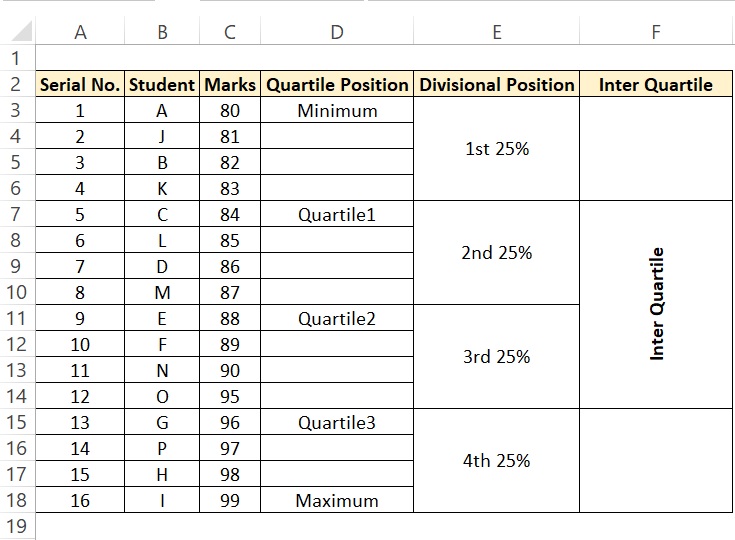
In the above example we can see quartile1 is at 84 while quartile 2 is at 88 and quartile 3 is at 96.And it divides whole data sets in four parts.
How to calculate quartile in excel
We will use excel formula QUARTILE.INC or QUARTILE.EXC. The difference between these two functions is that QUARTILE.INC bases its calculation on a percentile range of 0 to 1 inclusive, whereas QUARTILE.EXC bases its calculation on a percentile range of 0 to 1 exclusive.
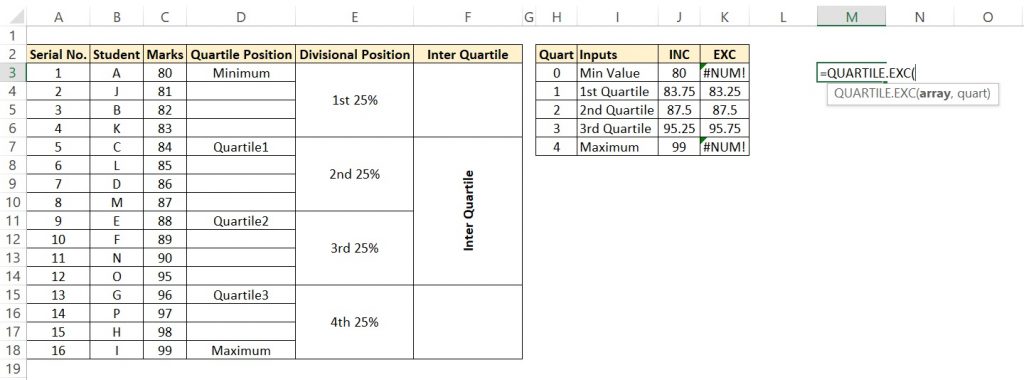
In the above example we can see how both the formula works. QUARTILE.EXC don’t take QUART 0(minimum value) and 1(maximum value) in consideration while QUARTILE.INCL takes it in consideration.
Inter Quartile range describes the middle 50% of data when sorted in order. To calculate Inter Quartile range we need to subtract quartile3 and quartile1.It is used to find the skewness of data as it is based on data which comes from middle of the dataset. It is very less likely to influenced by outliers(extreme) data.
Variance measures how far data points are from mean in a data set. It basically shows spread of data points in the dataset. Mathematically we are calculating it as below:

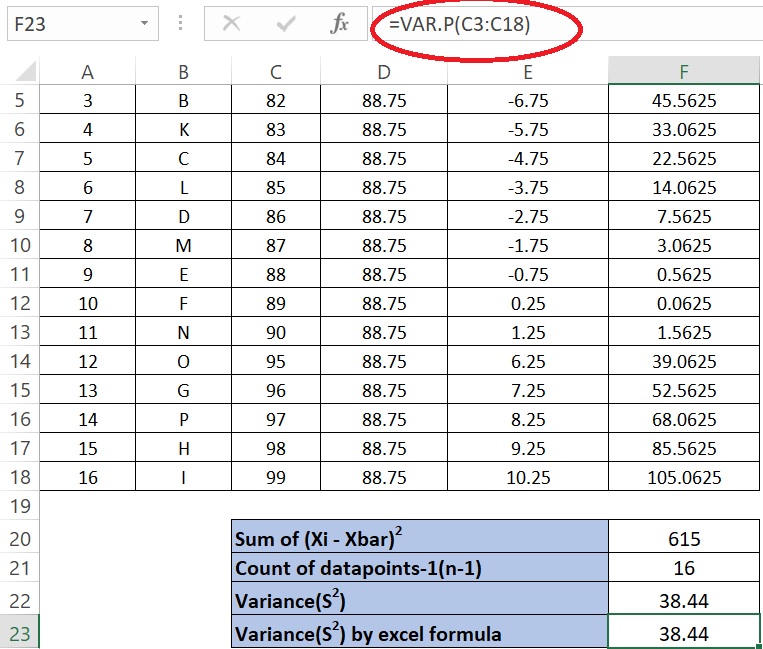
We will go through the method of calculation of variance in the below image.1st we will calculated mean of the data set , then we will subtract data points from mean. Finally we will square all new data points so that while adding all data points it wouldn’t even out themselves.
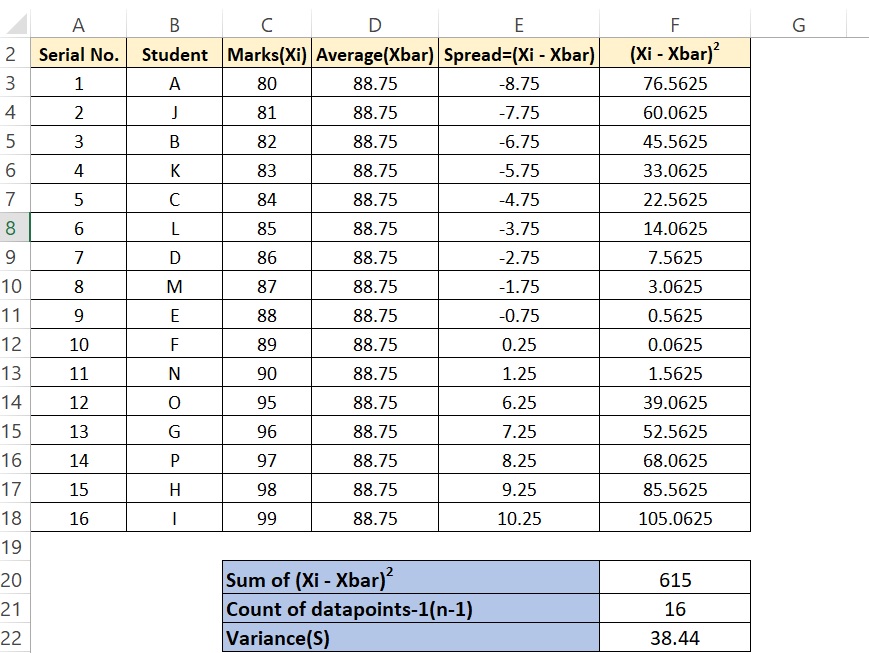
Finally we will sum all data points of square numbers and then divide it total number -1 to get variance.
How to calculate variance in excel
We will use VAR.P in excel and select data points. It will give us variance.
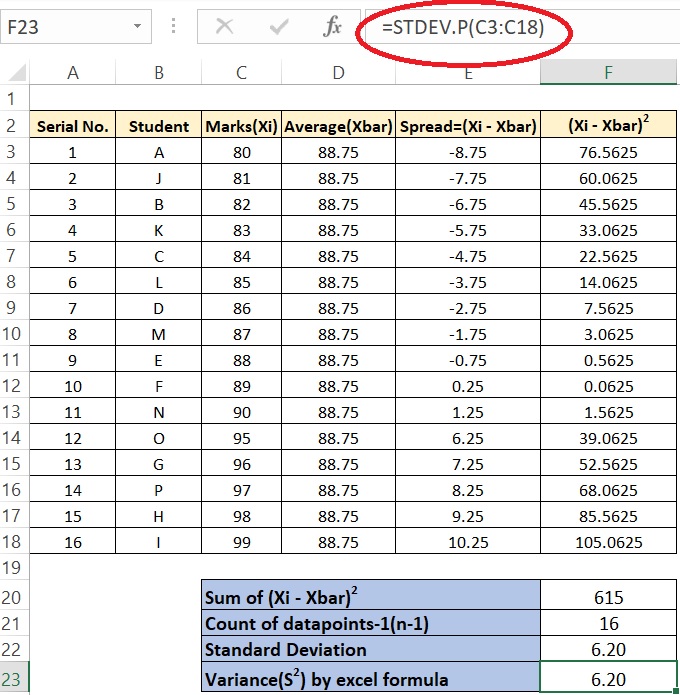
Standard Deviation is the square root if variance. Every step of calculation will be same as variance, we will just take square root.The mathematical calculation will be as below.

How to calculate standard deviation in excel
We will use STDEV.P formula in excel to calculate standard deviation in excel. Just put data points within the formula.
That is for all now. Will meet again with something new.