Correlation and Regression
What is a correlation:
Correlation is a test in statistics to get to know if there is any relationship exist between two datasets or not. Correlation is of two types positive and negative. A positive correlation means if one variable is increasing then 2nd variable is also increasing while a negative correlation shows if one variable increases then 2nd variable decreases.
Correlation between two data sets will be measured by the coefficient of correlation. The value of the coefficient of correlation lies between -1 and 1.If the value is zero it means there is no correlation between data sets. If the value is greater than 0 it means positive correlation and +1 will show a perfect positive correlation. While if the value is less than zero it shows -negative correlation between data sets and -1 means a perfectly negative correlation.
An example of correlation would be high weather temperature vs use of woolen cloth(-ve correlation) and use of ice cream(+ve correlation).
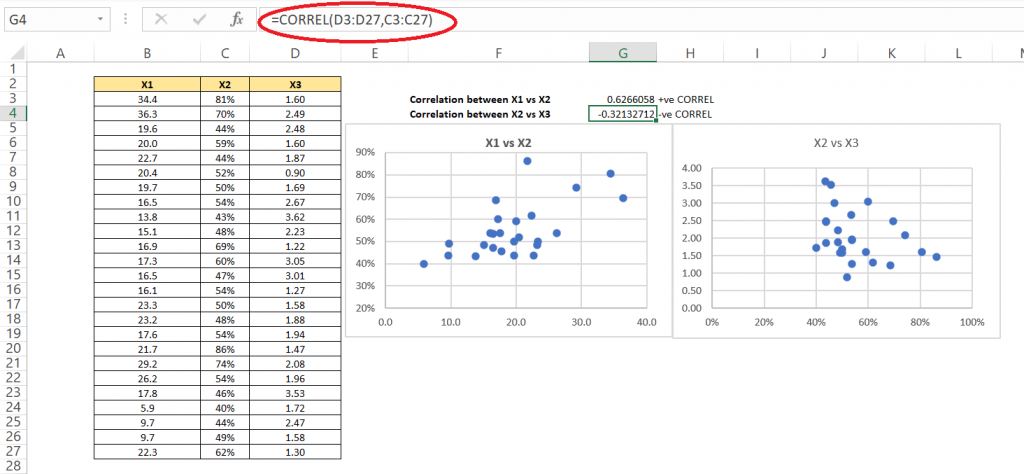
To calculate correlation in excel we will use the CORREL formula while for visualizing it we will use a Scatter chart. As in the below image, we can see we have 3 data sets X1, X2, and X3. We will try to find a correlation between X1 vs X2 and X2 vs X3.

In the above example, we can see a correlation between X1 vs X2 is positive while the correlation between X2 vs X3 is negative. Both graphs also show the same. As the values are not near 1 or -1 so the visualization is not very strong.
What is regression
Regression is a method of analysis that helps us to quantify a relationship between two or more variables by fitting a line through all the points such that they are evenly distributed about the line. The line is represented by a formula that is known as a regression equation. It is represented by a scatter chart.
Regression is mainly used to find out the effect due to a cause. It mainly estimates the value of an unknown variable(Y) based on a known variable(X1, X2,….).Among all regression Linear regression is considered to be the best fitting line through the data points.
The linear regression equation would be Y= aX + e where a is a constant and e is the error. We also get R2 and R2 Adjusted while doing regression analysis. Greater than .5 r square is considered as good.
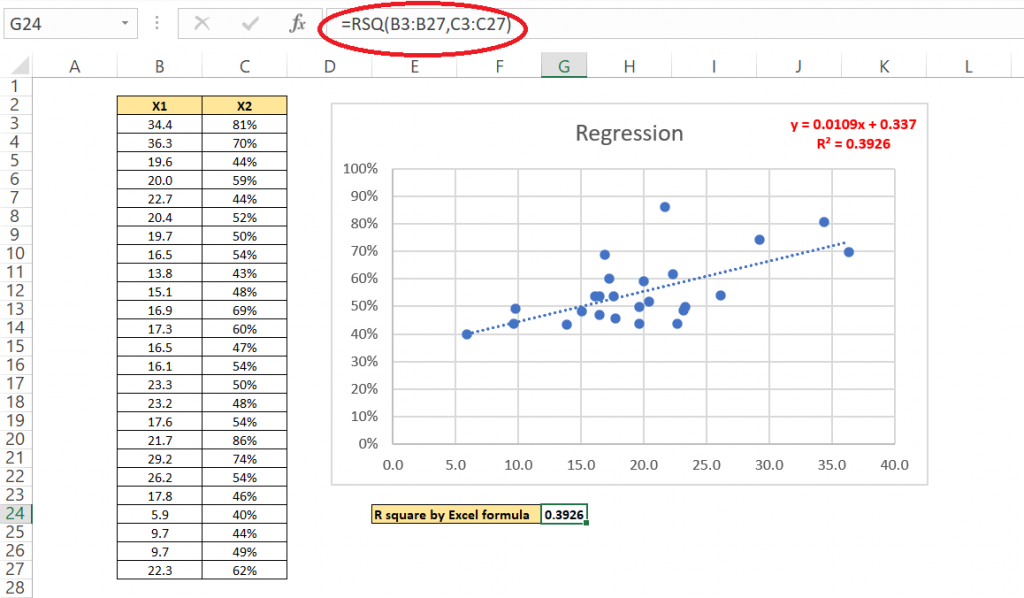
For calculating R-Square in excel we will use =RSQ(known_ys,known_xs) which asks for known_ys and known_xs values. In the below image we can see there are two variables X1(known_ys) and X2(known_xs). We plot a scatter chart and get the regression equation along with R2.

Also we used the excel formula from where we got the same R2 value.
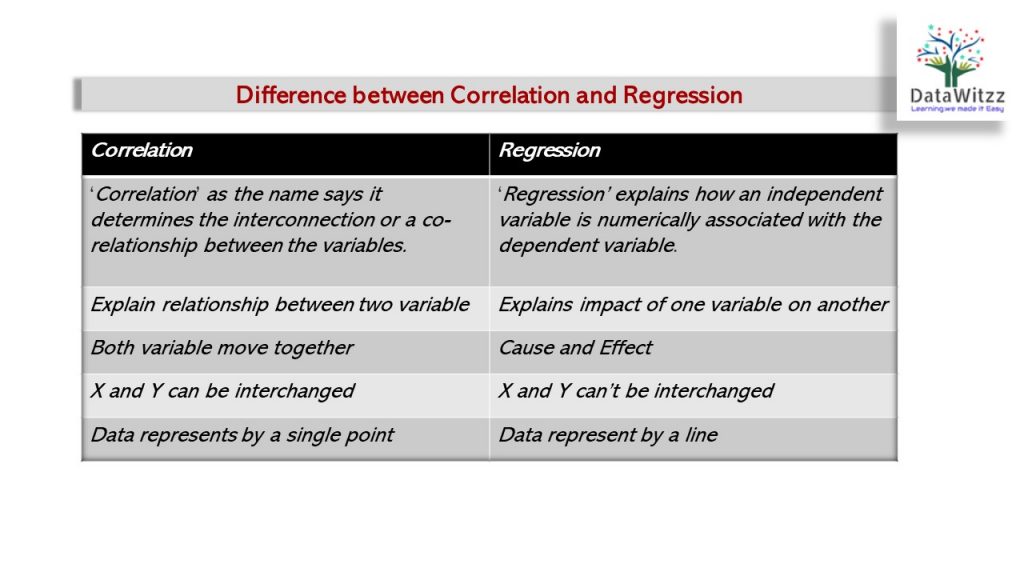
Difference between Correlation and Regression

You can read more on correlation and regression form the below article.