What are measures of central tendency?
A measure of central tendency is a single value that attempts to describe a set of data by identifying the central position within that set of data. These measures indicate where most values in a distribution fall and are also referred to as the central location of a distribution.
The three most commonly used measures of central tendency are mean, median, and mode. Each of these methods calculates the location of the central point by using a different method. Choosing the best measure of central tendency depends on the data we have.
Let us understand how to measure/calculate these central tendencies and how to determine which one is best for our data.
Mean/Average: Mean is the arithmetic average of a set of data. It adds all value of data and then divides the SUM by the COUNT of data. The mean is the most frequently used measure of central tendency because it uses all values in the data set to give us an average.

Above where n is the count of data points and X is individual data points. Let us do an exercise to understand the calculation by the below example.
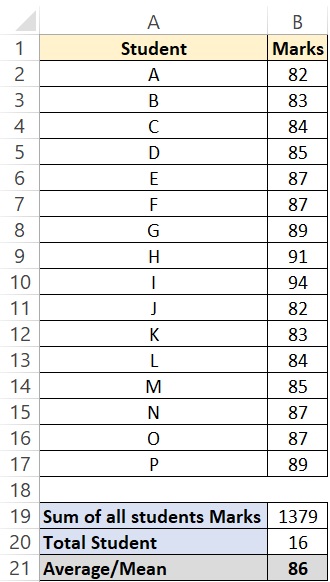
We have marks obtained for 16 students in the above picture. To find out what is the average marks obtained for the class are we need to sum all marks obtained which will be 1379 then divide it by 16 which is the count of students in the class. We would get 86 as an average score for the class.
To calculate average in excel we will use function AVERAGE then select all data points, here from cell B2 to B17.
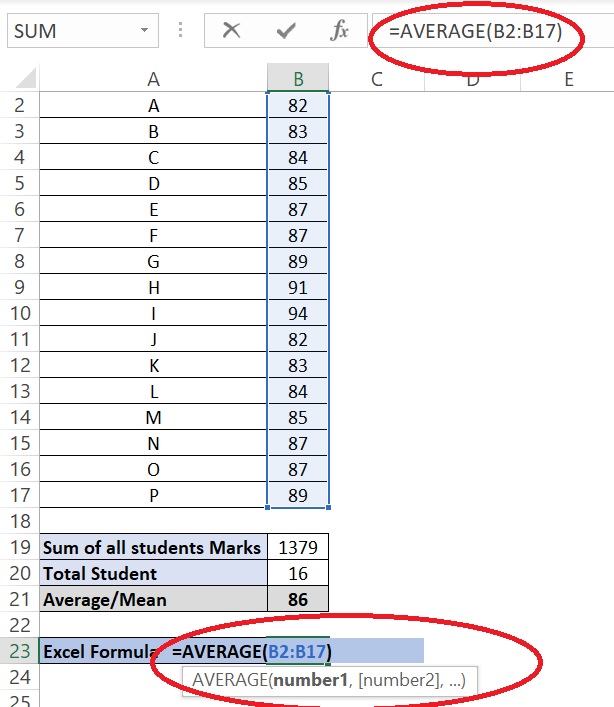
Median: Unlike mean, the median is based on the position of a given data set arranged in sequential order either ascending or descending. Therefor it is also called as positional average.
To determine the median we need to arrange the data in ascending or descending order. The median would be the center point, if there is an odd number of data points or the average of the two middle values. We can use a formula (n+1)/2 for odd number of data points while n/2 and (n/2)+1 for even number of data points.
Let us understand this with an example which already mentioned above. We will sort this dataset(marks) in ascending order. As we have 16 data points here so we need to average two middle points. Here 2 middle points would be 8th and 9th points.
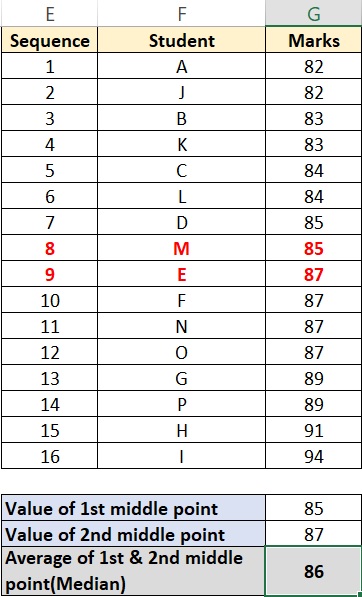
To calculate median in excel we will use excel formula MEDIAN. We need to just select the data points in this formula as like below.
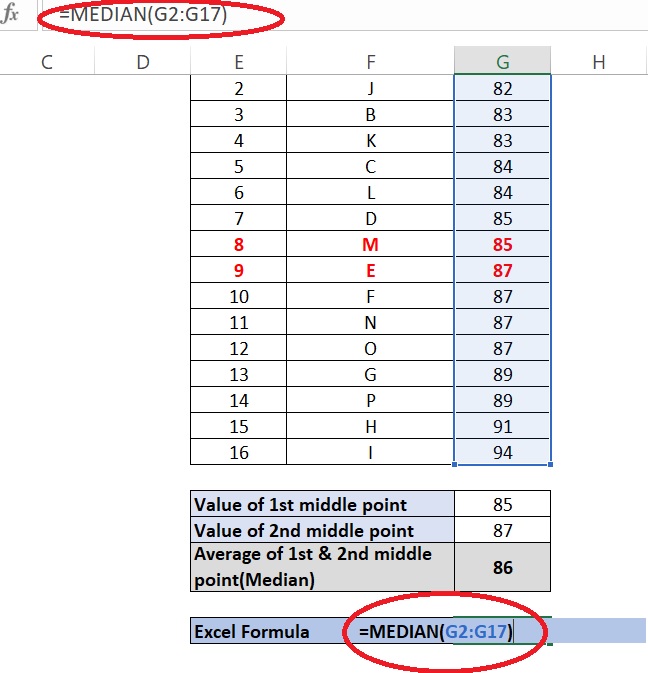
Mode: Mode for a data set would be the most frequent observed value(s) in the data set. If the data have multiple values that are tied for occurring the most frequently then we have a multimodal distribution. If no value repeats then the data do not have a mode.
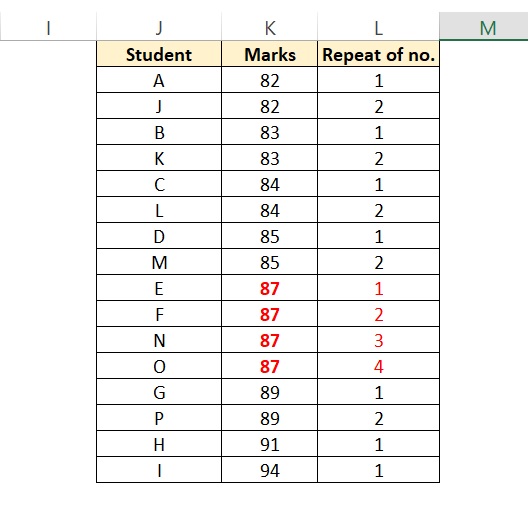
Let’s understand this by the same data set that we used in the above example. To make this more easily understandable I sort Marks data in ascending order and put their repeat count. We can see marks repeat itself 1,2 and 4 times. By definition the number which repeats highest number of times is MODE. So MODE for this data set would be 87.
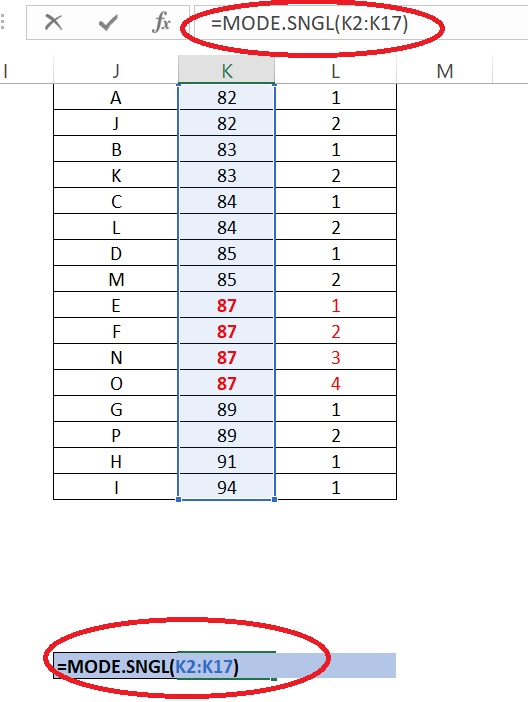
To calculate mode in excel we will use formula MODE.SNGL. We will select marks column in this formula with parenthesis and it will give output as 87.
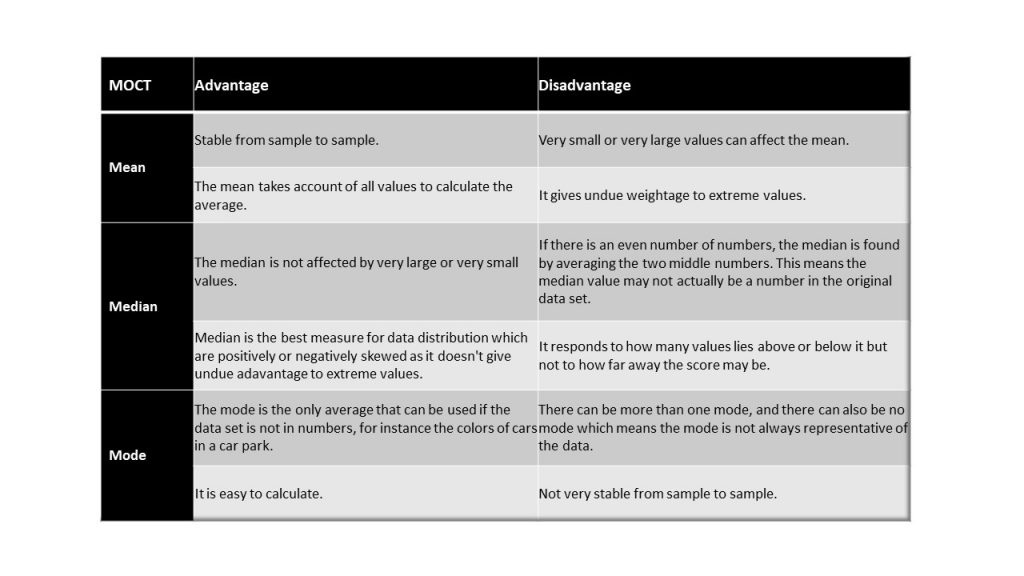
Below are few advantages and disadvantages of measurement of central tendency to better understanding.
You can also read more articles from the below links.
https://statistics.laerd.com/statistical-guides/measures-central-tendency-mean-mode-median.php
ahttps://www.c-sharpcorner.com/article/measure-of-central-tendency-in-statistics/
You can watch this video for more clarity.