What is Covariance in statistics
Covariance is a mathematical or statistical tool which measures the relationship between two random variables. Covariance evaluates how much – to what extent – the variables change together.
The covariance can take any positive or negative value and it interprets as
- Positive covariance: Indicates that two variables tend to move in the same direction.
- Negative covariance: Indicates that two variables tend to move in inverse directions.
The widespread use of Covariance is in finance for portfolio modelling to diversify the assets. We are choosing assets which don’t show a high positive covariance with each other and the unsystematic risk can be partially eliminated.
Mathematical calculation of covariance will be as given be:

Where inputs of formula are:
- Xi – the values of the X-variable
- Yj – the values of the Y-variable
- X̄ – the mean (average) of the X-variable
- Ȳ – the mean (average) of the Y-variable
- n – the number of data points
How to calculate covariance in excel
There are tow method for calculating covariance in excel
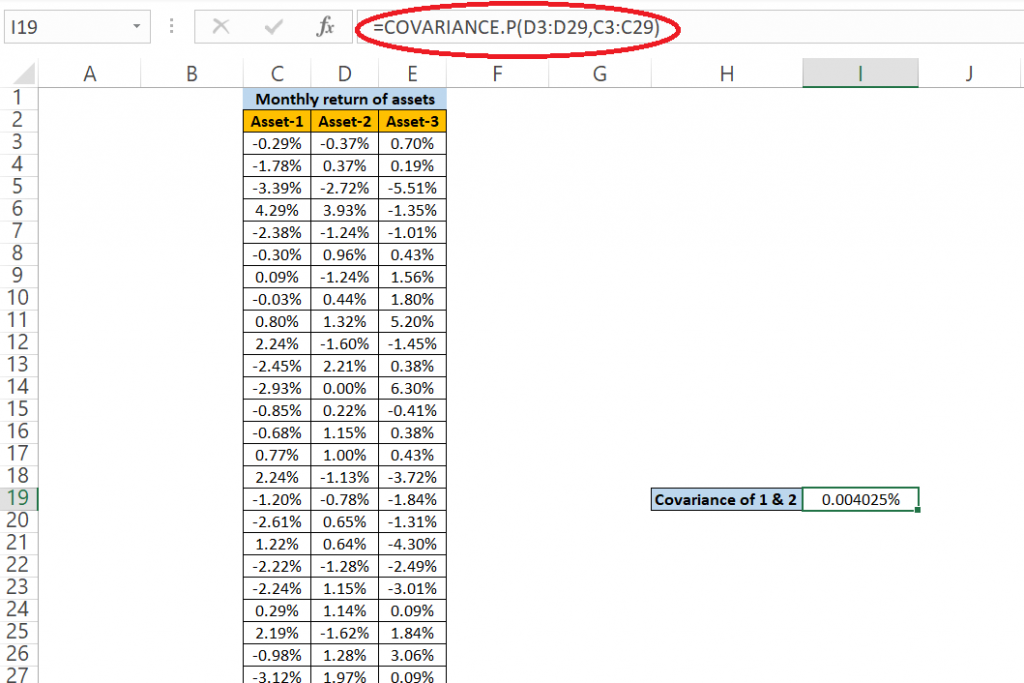
By using excel formula: We can use COVARIANCE.P – for whole population data or COVARIANCE.S – for sample data. We will use two data sets within this formula to get the value as can be seen in the below image.
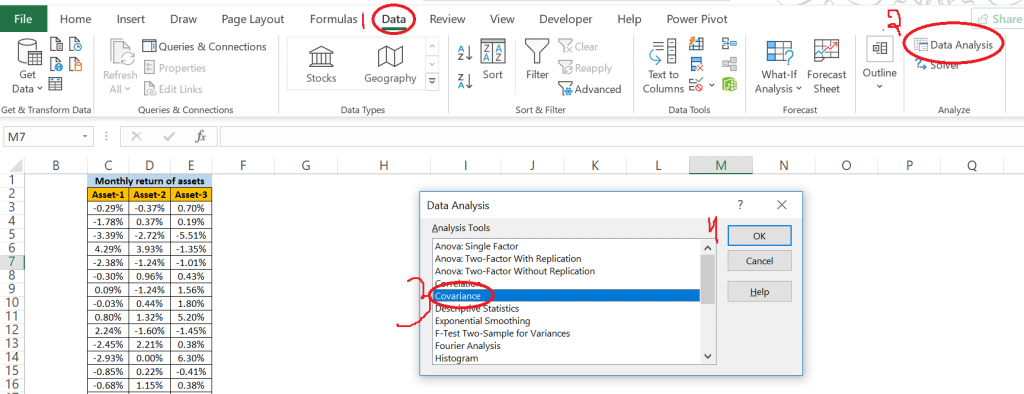
By using data Analysis tool from Data tab in excel: We will go in Data tab then in click to Data Analysis. A pop up will come select covariance and then click OK as shown in below image.
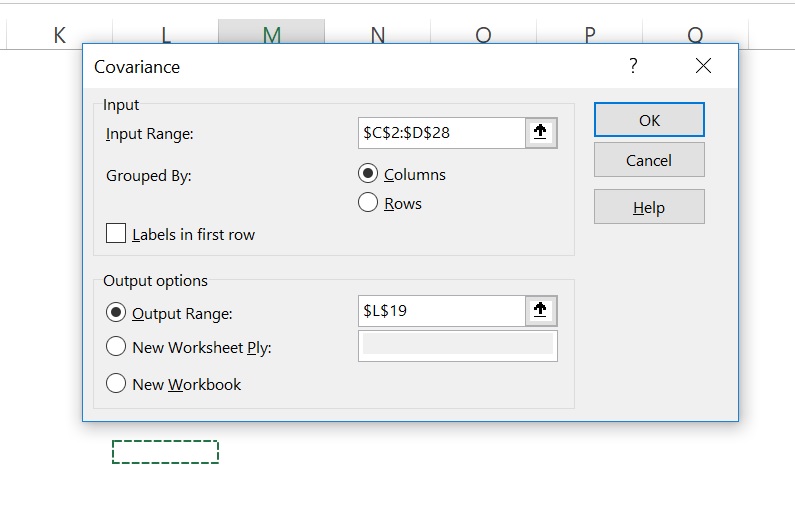
It will give us a new pop up box which asks for data sets in Input Range. After selecting data in Input Range select output range(where data should be thrown).
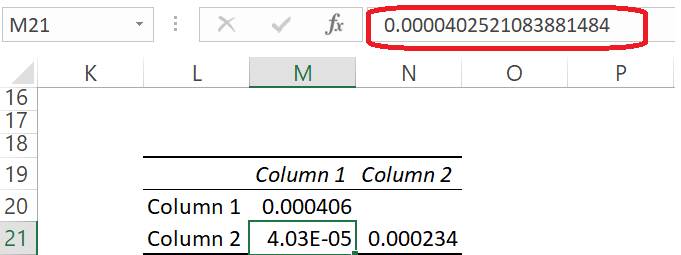
The output value will come as below, which is same as the value come from the excel formula.
What is the practical use of covariance
In the below example we are using covariance matrix to analyze which pair of assets we should take in our portfolio. We took 3 assets and use Data Analysis tool to get the results.
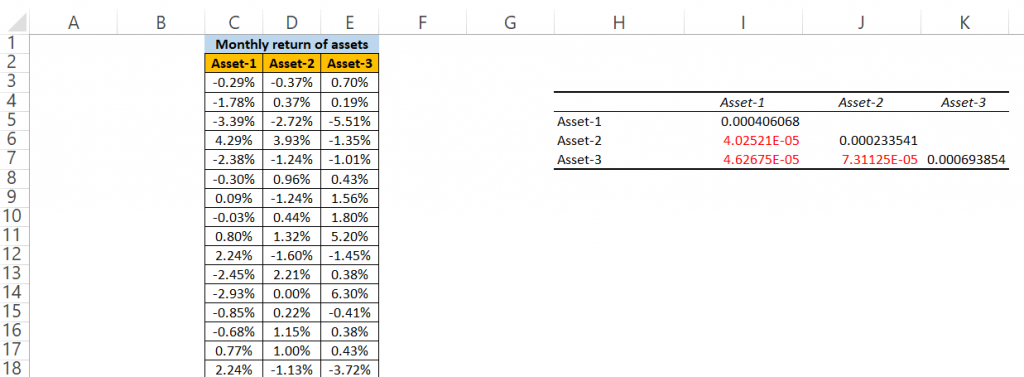
In the above image we will take inference from the red highlighted values Asset-1 vs Asset-2,Asset-1 vs Asset-3 and Asset-2 vs Asset-3.We clearly see the least covariance is between Asset-1 and Asset-2.So we will choose these two asset in our portfolio.
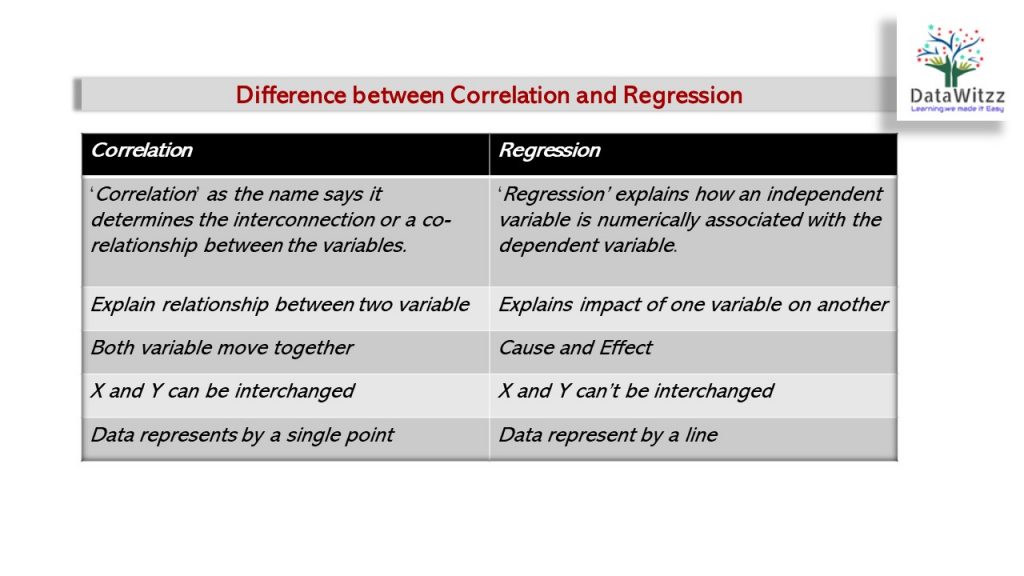
Difference between Covariance and Correlation:
People always confused Covariance with correlation, though both are different measures. Below comparison will help in understanding the difference between the two.
You can read more on covariance from the below article
https://www.statisticshowto.com/probability-and-statistics/statistics-definitions/covariance/
https://www.probabilitycourse.com/chapter5/5_3_1_covariance_correlation.php