What is Hypothesis testing in statistics
Hypothesis testing in statistics is a process by which we are confirming our hypothesis or prediction statistically. Scientists mainly use it to test the specific prediction from some theory or hypothesis or even from gut feelings.
Examples of Hypothesis Testing:
- The ability of Vitamin C to cure or prevent cold,
- Children of obese parents are more likely to be obese
- Men have taller than women
- Tenure calling operators have less handling time than a new operator.
Type of Hypothesis testing :
- Null Hypothesis : Null hypothesis states that there is no difference in parameters for two or more populations. If any observed difference in a sample is due to chance or sampling-related error, it is mentioned as H0. Its P-value is more than 0.05(a predetermined value called a significance level). This is an original hypothesis that we are observing.
- Alternate Hypothesis : Alternate Hypothesis states that the observed difference in the parameter is accurate and not due to chance or sample-related error. There exist a dependency between two or more factors. Ha denotes it, and it is the opposite of the Null Hypothesis. Its P-value is less than 0.05.
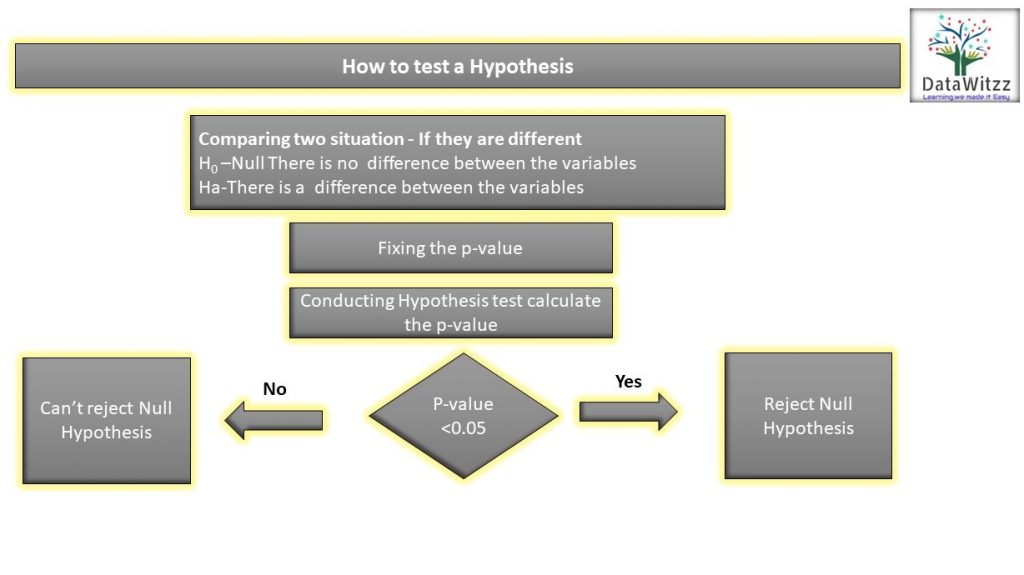
How to test a Hypothesis
There are five steps in hypothesis testing as below:
- State the Null Hypothesis: The 1st in Hypothesis testing is to define our null hypothesis. It is the commonly accepted observation or fact which we will try to nullify or accept the null hypothesis.
- State an Alternative Hypothesis: This is the opposite of null hypothesis and by rejecting the null hypothesis we are accepting the Alternate hypothesis.
- Determining an alpha or significance level(p-value): p-values are used to decide whether to reject null hypothesis or not. It is the probability that the observed relationship or difference in a sample exist by pure change or random. The lower the p-value means the greater the statistical significance of the observed difference(rejecting the null null hypothesis).
- Perform a hypothesis test to find p-value: Now we will conduct hypothesis test and the type of hypothetical test will depend on the data type of data that we have collected.
- Draw a conclusion from p-value: If p-value meets significance level then we will reject null hypothesis and the alternative hypothesis will be valid. In other words, if we choose significance level 4% and the p-value comes 2% then we will reject null hypothesis and choose alternate hypothesis.
Hypothesis Testing Examples
Average Height of female is less than average height of male
It is very commonly observed that height of males are more than female. In this test we will take sample data of students from a college and will run a test.
- Null hypothesis – Average Height of females is less than average height of males.
- Alternative hypothesis – Average Height of females is greater than average height of males.
- Significance level – The significance level is 0.05.
- Perform Hypothesis test– We will run one tailed t-test to test whether average Height of females is less than the average height of males.
- Conclusion – If p-value is more than 0.05 then we will accept null hypothesis.

How to do Hypothesis testing in excel
Excel has formula for many hypothesis testing as well it has Data Analysis pack by which we can do many tests. I am explaining the process of one example in which null hypothesis is height of male and female is equal. We took two samples of data set, one for male and another for female. We have null hypothesis that mean height is equal for both gender.
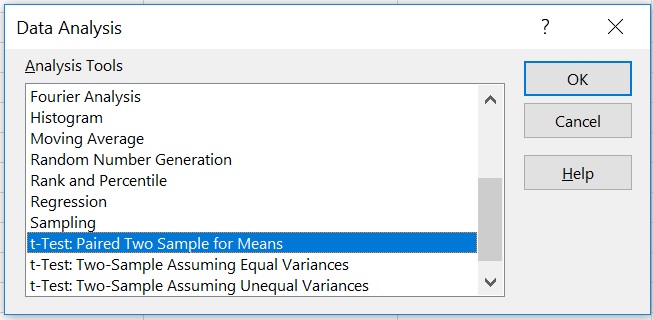
To run the test we will got to Data tab then Analysis section and then Data Analysis and then click OK.

A new pop up will come with different options, we will select t-Test: Paired Two Sample for Means and click OK.

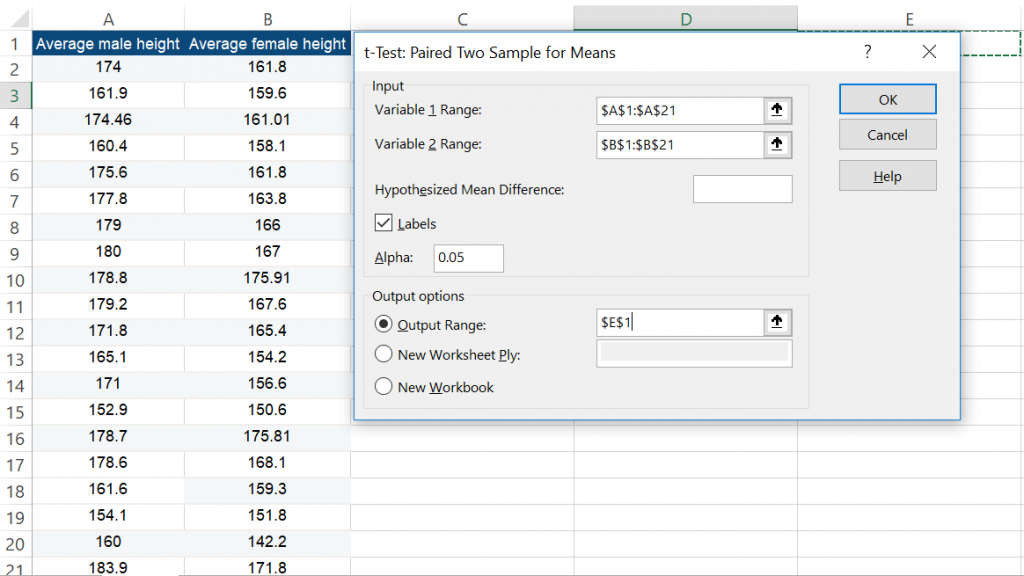
Now we will get another popup box which asked for variable input, Alpha(p) value and output range. After selecting all options click OK.

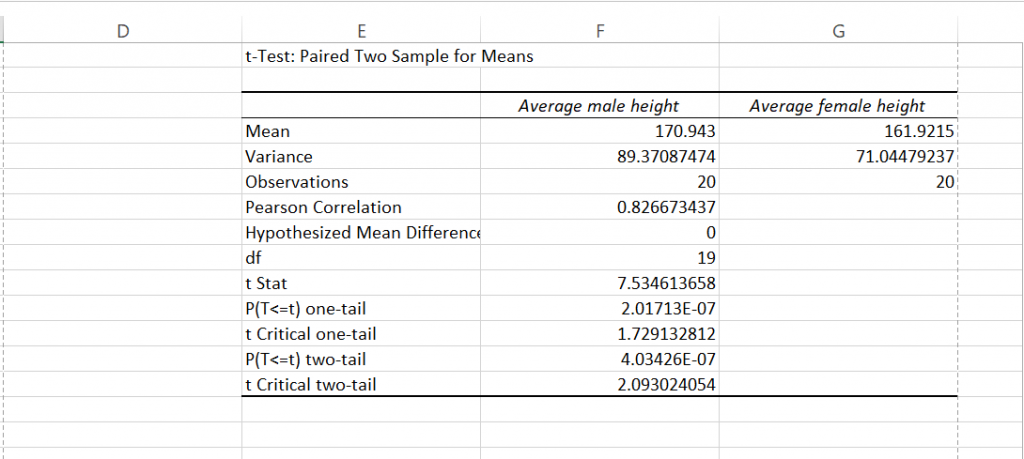
The final results will come in the mentioned output range.

The above image gives us many numbers. The important one to see is mean of both variable and P(T<=t) one-tail which is less than 5%.As p-value is less than 5% so we will reject null hypothesis that height is equal for both male and female
You can read more on Hypothesis Test from the below mentioned article.
https://www.statisticshowto.com/probability-and-statistics/hypothesis-testing/
https://stattrek.com/hypothesis-test/hypothesis-testing.aspx
Pingback: Type I and type II errors in statistical hypothesis testing: How to use it - DataWitzz