How to create group in excel pivot table
In our previous article, we learned about what is a Pivot Table and how to create it. Now we will try to explore more about the pivot table. In this quest, we will try to understand how to make a group in an excel pivot table without using any formula. Group is making categories of our data to make it more readable.
How to create group in excel pivot table
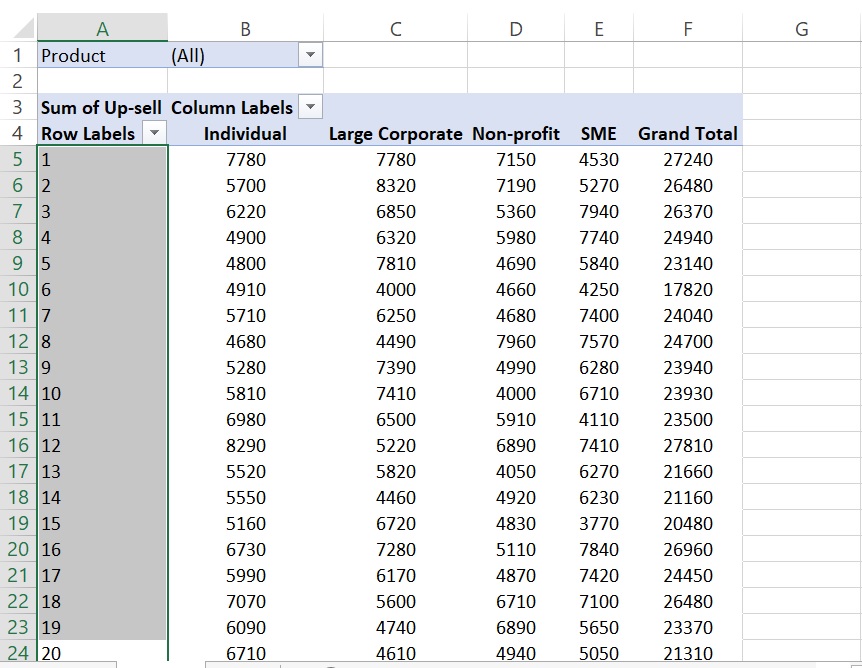
One of the best features of excel pivot is to group data without using any complicated formula. In the below image we can see our data set Call Duration in the Rows area is a set continuous number.

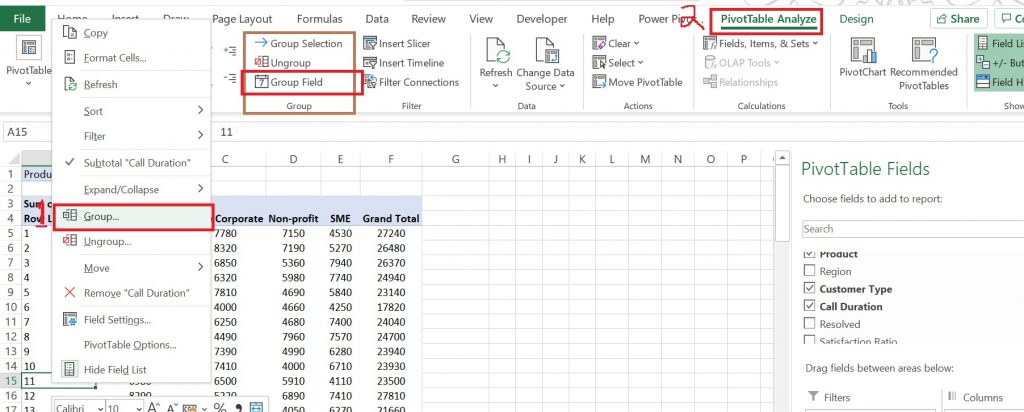
As we can see it is very difficult to read the data so we can make it readable and understandable by using the Grouping option of pivot table in excel. To use the grouping option we can use two methods.
- By right clicking on Rows area and then choosing Group option
- Selecting PivotTable Analyze then under Group click Group Field.

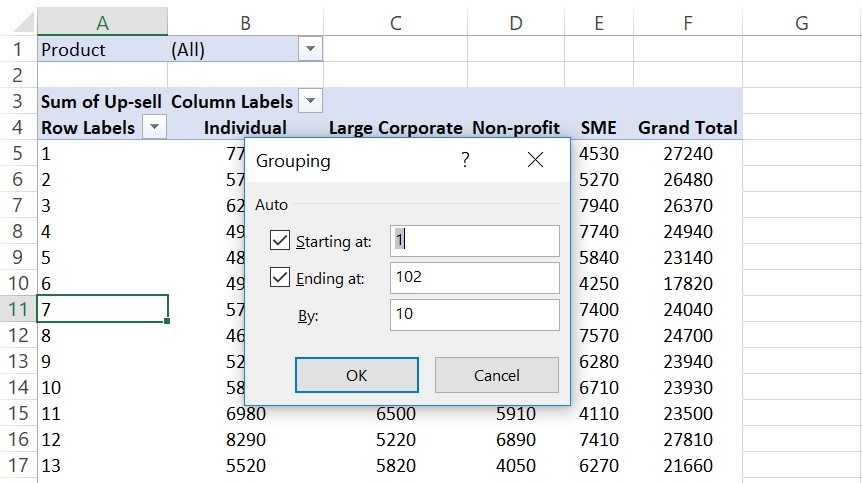
After clicking any of these options we will get a new option box as shown below.

We got three options to fill here.
- Starting at : Which is a value from where group value should start.
- Ending at : The last value in the group.
- By : It means what should be the gap between intial and last value of each categories.
After providing our input, click OK.

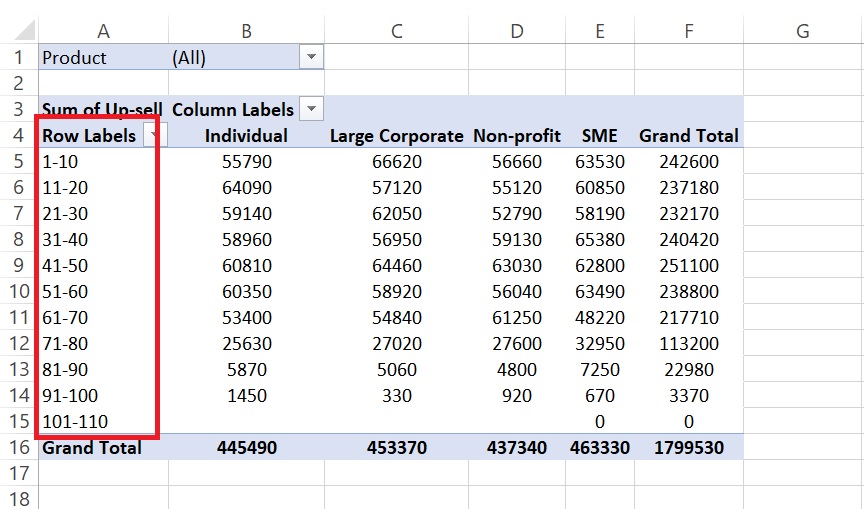
In the above table, we can see how our values got converted to different groups. If we see the image before the above image we put inputs Starting at: 1, Ending at: 102, and By: 10. Now if we check these categories our first category starts from 1 and ends at 10, so there is a gap of 10, now if we see the second category it starts from 11 and ends at 20, a gap of 10.
The last group starts from 101 and ends at 110 a gap of 10 between the start and end numbers. Also, it is to be noted here that we had given our input for Ending at 102 but here last value in the category shows as 110 . It is due to By value which we gave as 100 so it ends 110 as the start value was 101.
That was all for how to make group in excel pivot table without using any formula. Will meet again with new topics.
You can read more about group items in the excel pivot table from the below articles.
- https://www.excel-easy.com/examples/group-pivot-table-items.html
- https://www.contextures.com/xlpivot07.html
You can also watch this video for more clarity.