Bubble Chart
Bubble chart in excel is a variation of scatter plot. In scatter plot we use points for representation while in bubble chart data points represented by bubble. Like scatter plot, bubble plot is also not using category value as axis. We will use Bubble chart when we have at least three or more sets of data to represent in the chart. Out of these three dataset, two will be representing as X and Y axis while the third data point represented by the size of bubble.
There are two types of Bubble chart available in excel 1)Bubble and 2) 3-D Bubble.
How to create Bubble Chart in Excel
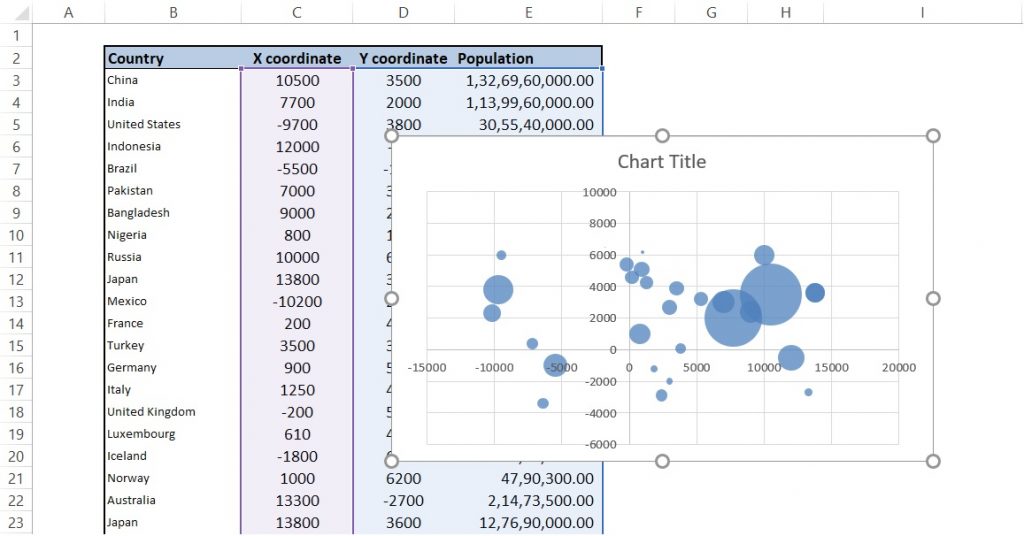
Like other charts after selecting our data we will go to Insert >> Insert Scatter (X,Y) or Bubble Chart >> Bubble or 3-D Bubble. It is to be noted here that we will select only data points not the categorical values neither column header. A new Bubble chart will come as below.

In the above chart we can see value of X coordinate is represented in X-axis while Y coordinate is represented in Y-axis. While Population is represented by the size of bubble.
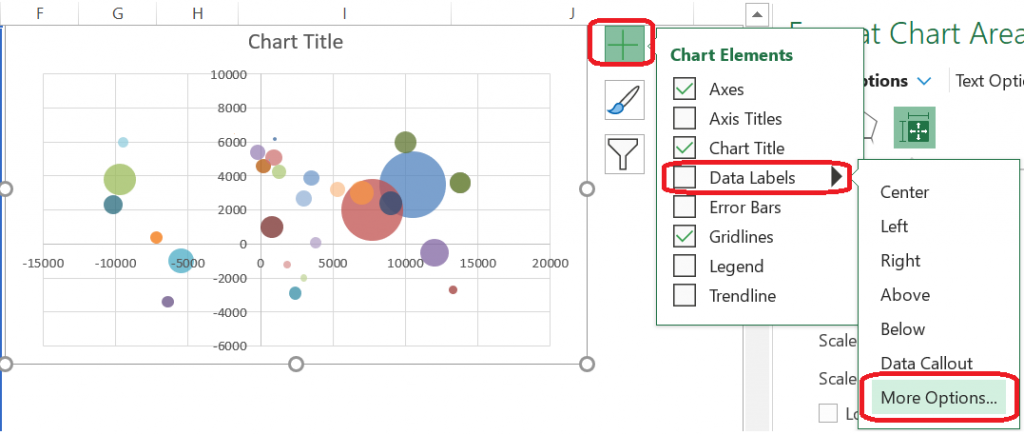
One point to be noted here is that if we want to show category on the plot then we need to go in Chart element >>Data Labels >> More Options as illustrated in the below image.

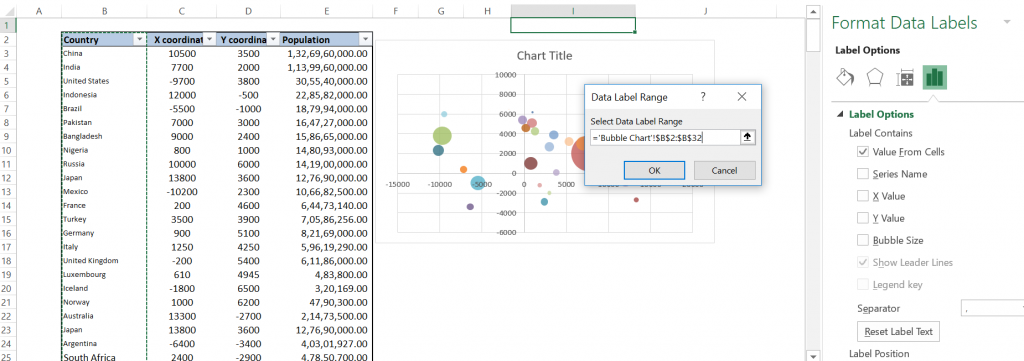
A new box will open on the right side. We will select values from cells, a pop up will emerge which will ask to select a range.

After selecting range of categorical value, category names will started to reflect on the chart. We can re arrange them depending on our requirement.
There are few advantage and disadvantages as well of bubble charts.
| Advantage | Disadvantage |
|---|---|
| It is a better option when applied for 3 sets of data. | For new user it may be difficult to read the chart. |
| It is an eye catching chart especially the bubble sizes. | Sometimes bubble sizes confuses as well. |
| It is better than table format | Overlapping of bubbles create a lot of problem |
That is all for now for the bubble chart will connect again with something new.
https://www.formpl.us/resources/graph-chart/bubble/
You can watch below video also for better understanding.