Case interviews test your ability to translate ambiguous business questions into measurable analysis. Interviewers look for structured thinking, practical metrics, and clear recommendations. This post gives you interactive prompts, model answers, and an end‑to‑end case you can practice before your next interview.
Section A — Problem Framing & Hypothesis-Driven Approach
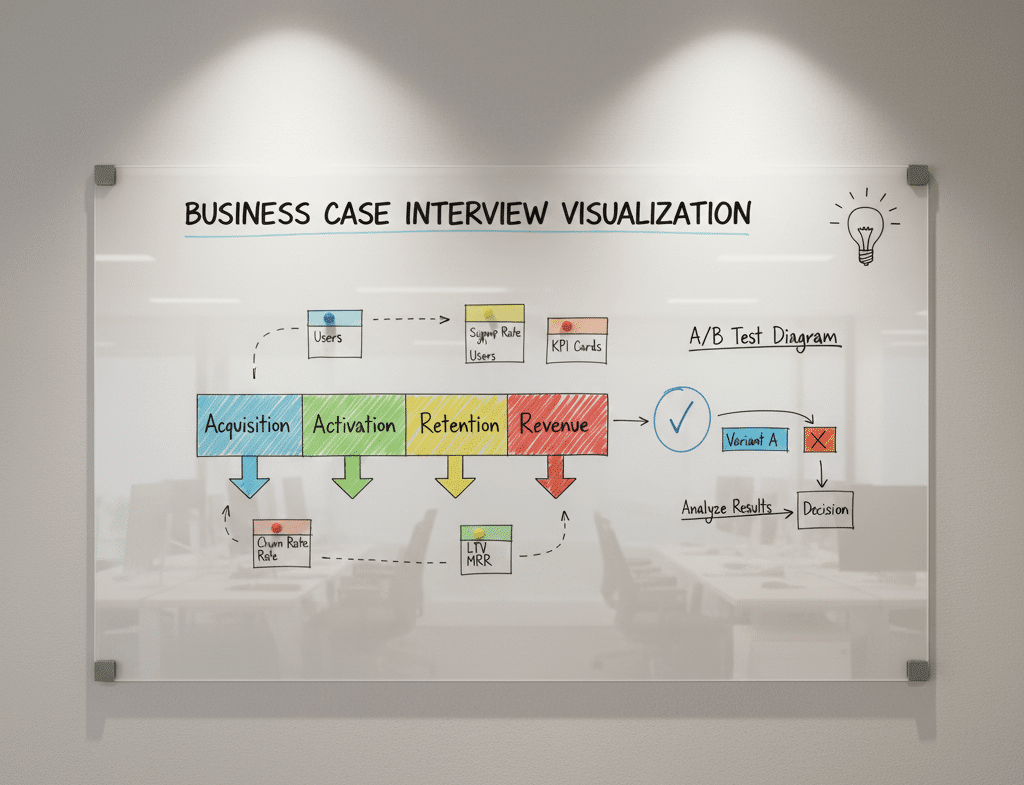
1) Framework to turn a vague problem into an analytical plan
Answer (4-step structure):
- Clarify the goal (business outcome, audience, constraints).
- Define metrics (north star + supporting KPIs).
- Form hypotheses (what could move the metric and why).
- Prioritize analyses (impact × effort, data availability, time).
Explanation: This keeps you outcome-focused, avoids “analysis paralysis,” and aligns stakeholders early.
Your Turn: Pick a recent analytics project. Write a one‑sentence goal, 3 supporting KPIs, and 2 testable hypotheses.
Section B — Metric Design & Guardrails
2) What is a North Star Metric (NSM) and how do you choose one?
Answer: The NSM captures long‑term value delivered to customers (e.g., “weekly active creators” for a content platform). Choose metrics that are leading indicators, user‑centric, and hard to game.
Supporting Metrics: Activation rate, 7‑day retention, session depth, conversion rate, revenue, NPS.
Guardrails: Quality (defect rate), support tickets, latency—ensure growth doesn’t degrade experience.
3) Design a metric to measure feature adoption
Answer & Outline:
- Adoption Rate:
users who used feature / eligible usersin first 14 days. - Depth: average events per adopter.
- Stickiness: repeat usage over time (e.g., 3+ uses in 30 days).
- Eligibility Rules: define who can use the feature (availability, plan access).
Pitfalls: Counting non‑eligible users, inflating by accidental clicks, ignoring repeat behavior.
Section C — Experiment Design (A/B Testing) for Analysts
4) When should you run an experiment vs. do an observational study?
Answer:
- Experiment: You control treatment assignment (randomized), aiming for causal inference.
- Observational: You analyze historical data where treatment wasn’t randomized—use matching/stratification, difference‑in‑differences, or instrumental variables to reduce bias.
5) Key steps to set up a robust A/B test
Checklist:
- Define hypothesis and primary metric (e.g., conversion).
- Eligibility & randomization unit (user/device/storefront).
- Sample size & duration (power analysis; stop only with pre‑defined rules).
- Guardrail metrics (latency, error rate).
- Instrumentation & logging (event definitions).
- Analysis plan (frequentist vs Bayesian, segmentation, variance reduction).
Common Mistakes: Peeking early, changing metrics mid-test, mixing sessions and users, ignoring novelty effects.
Section D — Stakeholder Communication
6) How do you present results to non‑technical stakeholders?
Answer:
- Start with business context and the decision at hand.
- Show one clear story: metric movement, confidence, impact.
- Add visuals (trend lines, funnel) and plain language takeaways.
- End with actionable recommendations, risks, and next steps.
Template Slide Order: Problem → Metric → Method → Result → Impact → Recommendation → Risk/Next step.
Section E — End‑to‑End Case Walkthrough
Case Prompt: “Weekly registrations are flat; the CEO wants growth before the holiday season. What’s your plan?”
Step 1 — Frame the Problem
- Goal: Increase qualified registrations by 15% in 8 weeks without harming activation.
- North Star:
Qualified registrations per week(email verified + completed onboarding step 1). - Guardrails: Activation rate, support tickets, page latency.
Step 2 — Hypotheses
- Traffic mix shifted to lower‑quality channels.
- Landing page friction (slow load, confusing form).
- Onboarding path too long; mobile errors.
- Seasonality dampening intent.
Step 3 — Analyses
- Funnel: sessions → click‑through → form start → submission → verification → activation.
- Segmentation: device, channel, region, new vs returning.
- Diagnostic: page speed, error logs, drop‑off by field.
Step 4 — Insights (Example Narrative)
- Organic stable; paid social up but lower conversion.
- Mobile form shows 33% drop‑off at phone verification step; load time p95 ↑ from 2.1s to 4.3s.
- Activation constant, so primary friction is pre‑verification.
Step 5 — Recommendations
- Two-step form on mobile; defer non‑critical fields.
- Optimize media: reallocate spend to high ROAS channels; add UTM hygiene.
- Technical fixes: compress images, lazy-load, CDN cache; target p95 < 2.5s.
- Experiment: A/B test new mobile form (primary metric verified registrations; guardrails activation & latency).
Step 6 — Expected Impact & Plan
- Estimate: +10–14% verified registrations (based on funnel uplift at form completion).
- Timeline: 2 weeks build, 3 weeks test, 2 weeks rollout.
- Risks: Bot sign-ups—add reCAPTCHA; measurement drift—align event schema.
Interview Delivery Tip: Speak in time‑boxed phases and quantify impact with assumptions. Offer a fallback (observational study) if engineering bandwidth is limited.
Section F — Mini Case Library (Practice)
- Churn Spike After Price Change
- Metrics: churn rate, downgrade rate, cohort NPS.
- Approach: interrupted time series; segment by plan & tenure; simulate price elasticity.
- Feature Prioritization for Q1 Roadmap
- Scorecard: impact, confidence, effort (ICE).
- Data: adoption, retention lift, support burden.
- Sales Ops: Lead Quality vs Volume
- Build a lead scoring model; analyze conversion by source; propose SLA and routing rules.
- Marketplace Health
- Balance supply/demand; measure fill rate, time‑to‑match, repeat rate; guardrail cancellation/returns.
Quick Practice (Interactive)
- Draft an A/B test plan for reducing checkout drop‑off (primary metric, unit of randomization, duration, guardrails).
- Build a funnel analysis in Power BI: page views → add to cart → checkout → purchase. Add YoY comparison and slicers by device.
- Write 3 stakeholder‑friendly recommendations from a mock dashboard showing mobile latency spikes.
Common Case Interview Mistakes & Fixes
- Jumping to solutions → First define the metric and diagnose where the funnel breaks.
- Too many metrics → Pick one primary outcome with 2–3 guardrails.
- No quantification → Estimate impact and confidence.
- Unclear communication → Use a structured, slide‑ready narrative.